


Executive Summary
This article is a brief survey of various arrangements of the Table of Isotopes. It includes the classic form of n by z, several others with somewhat less graphic space, and a particular solution with less than a quarter the graphic area.
Main Article
The table of isotopes is used to study patterns in isotope behaviour. This is somewhat difficult due to the standard arrangement being a long thin strip, diagonally presented in a large rectangular shape. A standard solution is to chop the table into many short lengths, which loses the larger patterns.
Many alternative arrangements to the table are possible. Some are worse than the standard, and a few are better. A method of examining the relative usefulness of an arrangement is to see how many cells the table occupies in the minimum rectangle circumscribing it. For this discussion, I will only use the main block of the table, excluding the 2 outliers (ununhexium 303 and 304).
The standard arrangement has neutron count on the x axis and proton count on the y. These are routinely referred to as n and z respectively. The sum of these (n+z) is often referred to as A (the baryon count). Known isotopes have neutron counts from 0 to 178 and proton count from 0 to 118. The standard arrangement has 179 columns and 119 rows (or vice versa), occupying a rectangle with 21,301 cells. 2 obvious alternatives have baryon count on the x axis and either n or z on the y axis. Baryon count ranges from 1 to 294, so these arrangements have 52,626 and 34,986 cells respectively.
Less obvious arrangements may have better space utilization. The difference between neutron count and proton count (n-z) has a range of -8 to +61, for 70 possible solutions. Further, odd differences correspond to odd baryon count and even differences to even, so mapping n-z to A has a table with 147 columns and 70 rows, or 10,290 total cells. Similarly n-2z has a range of -69 to +4, for 74 possible solutions. Here the solutions map to 3 subsets of the possible baryon counts: 3m, 3m-1, and 3m+1. Therefore the table has 98 columns and 74 rows, or 7252 total cells.
At first glance we can’t do better than this, since other multipliers lead to larger ranges. However, combining n-z by n-2z yields a 70 by 74 table that is a linear bijection to the original solution, and has only 5180 cells. This is less than a quarter the original area, and shows the whole table of isotopes in a single frame. Rotating this solution 45 degrees gives 2n-3z on the y axis and z on the x, again with odd/even split for 88 rows of 60 columns each, or 5280 cells (2n-3z ranges -58 to +29). Minor changes have similar solutions with n+z (3 subsets) or n (again 3 subsets) versus 2n-3z. Other solutions with 2n-3z are also possible, although they occupy more space than the minimum solution. Slightly larger solutions involving 3n-5z (152 solution points from -127 to +24) are also described in the following table.
Many of the charts extend past Dirac’s Limit (z~137). That area is marked as a red triangle, indicating no possible isotopes there.
Summary
| A | n | z | n-z | n-2z | 2n-3z | 3n-5z | |
| A | 300×180 54,000 cells |
300×120 36,000 cells |
300/2×70 10,500 cells 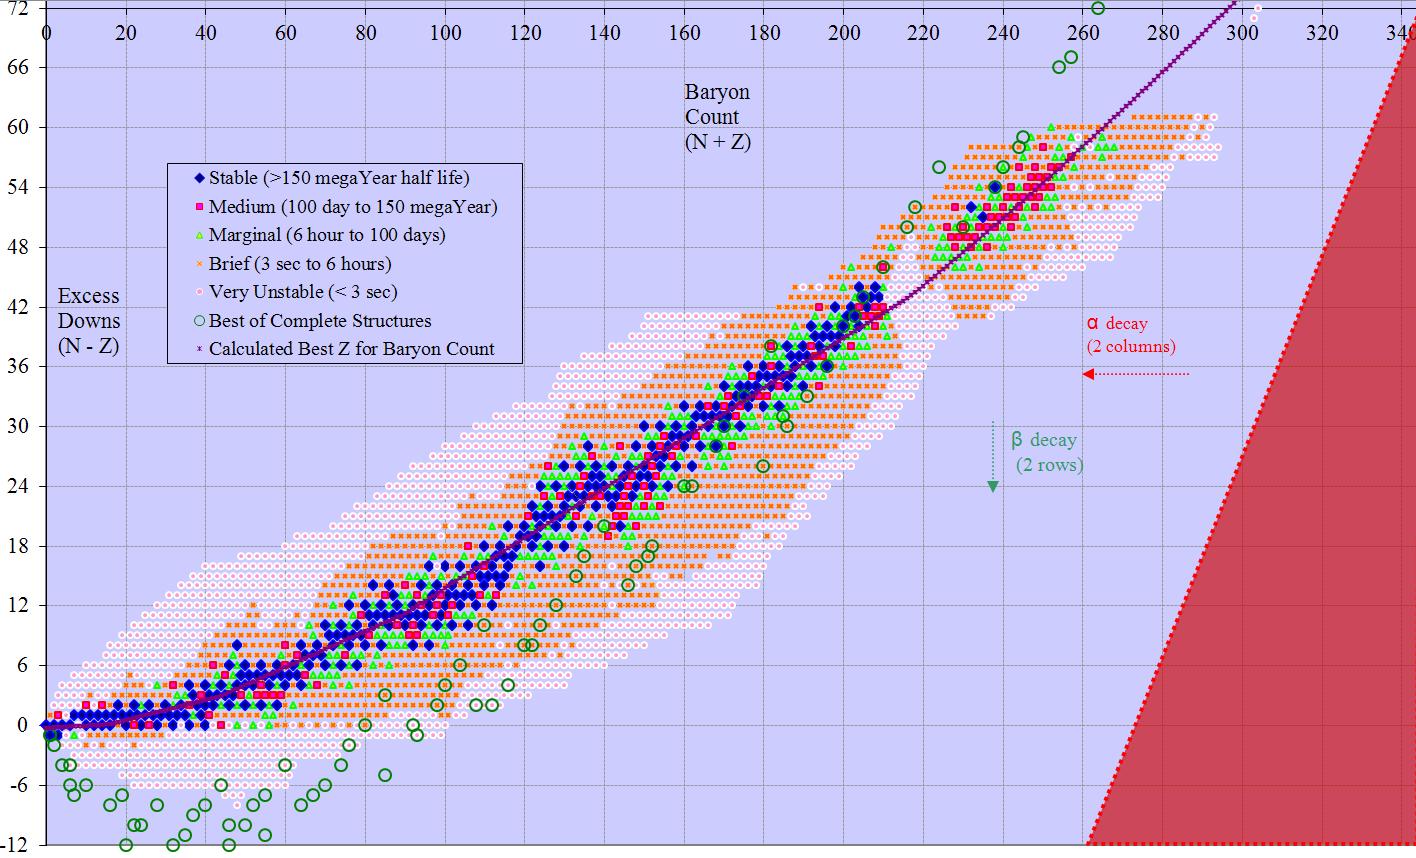 |
300/3×74 7,400 cells 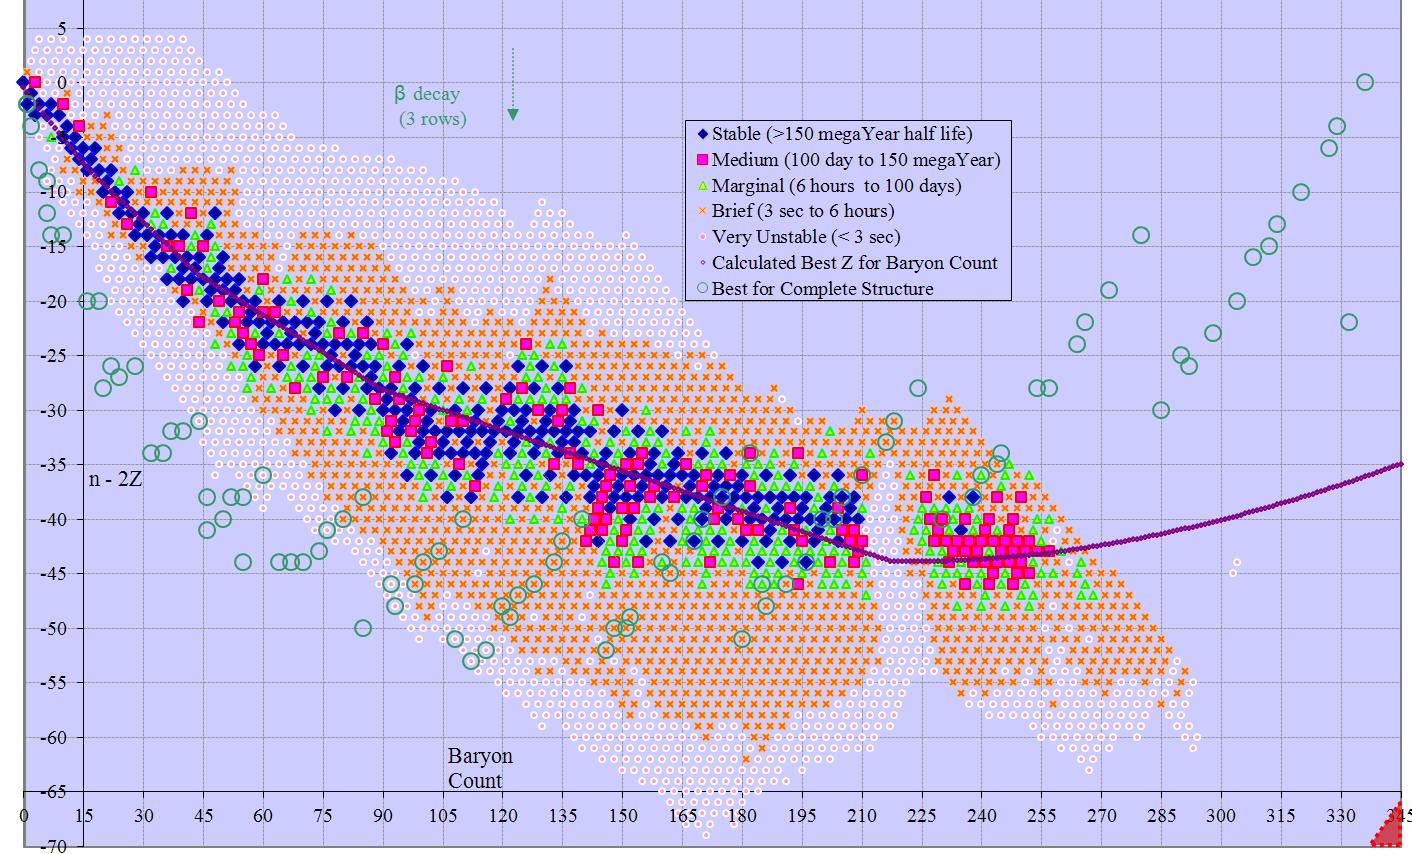 |
300/3×88 8,800 cells 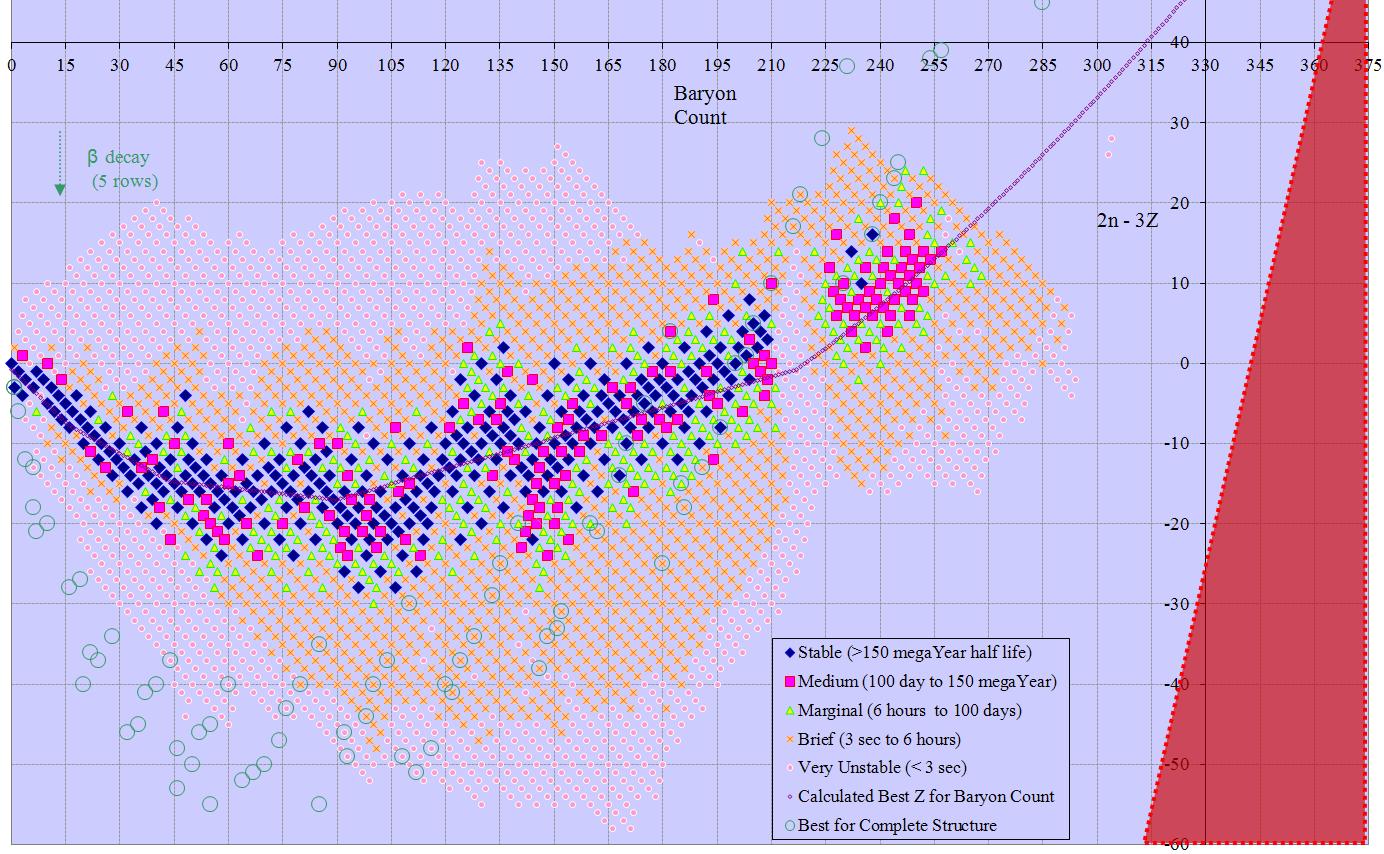 |
300/5×152 9,120 cells 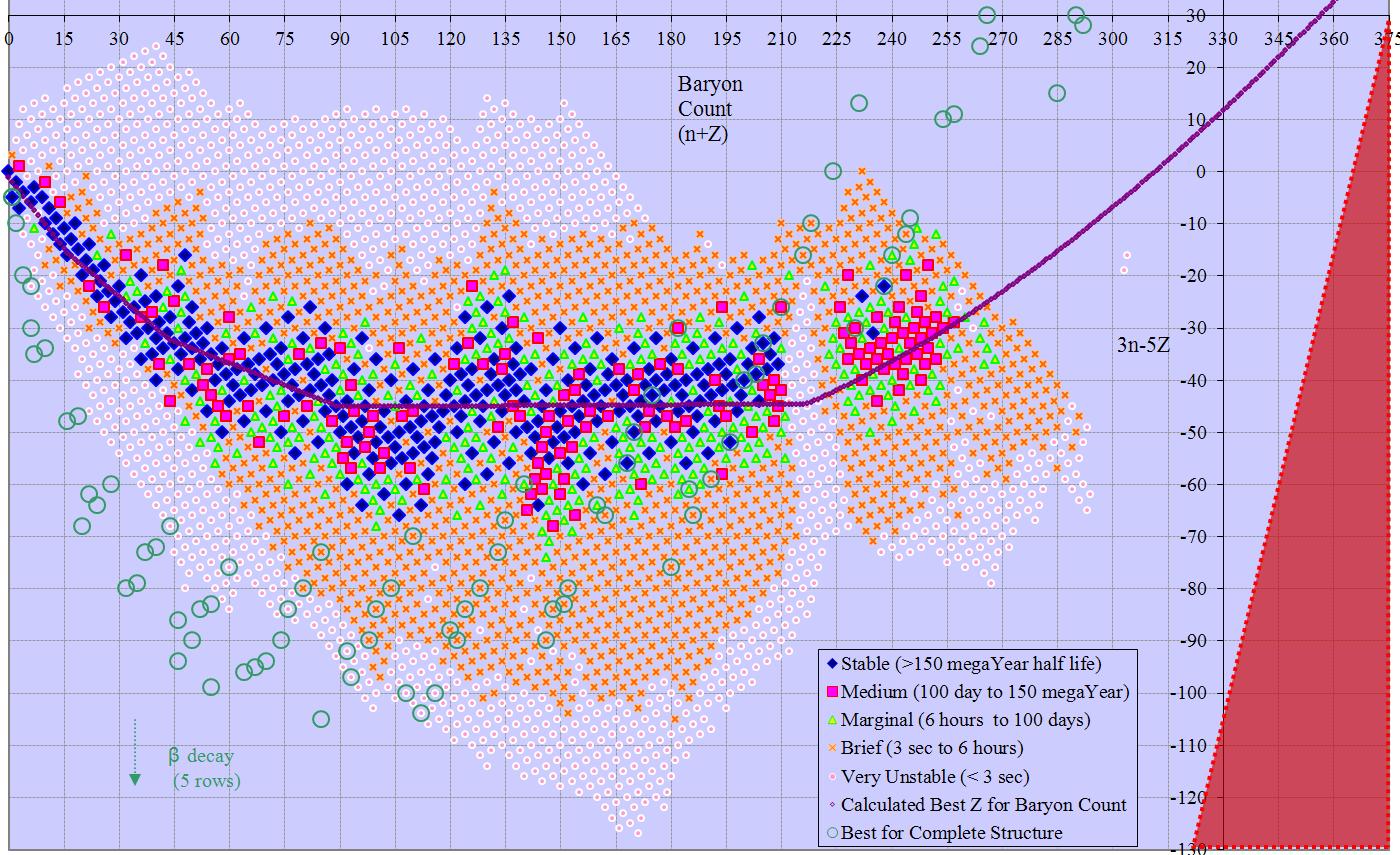 |
|
| n | 180×300 54,000 cells |
180×120 21,600 cells 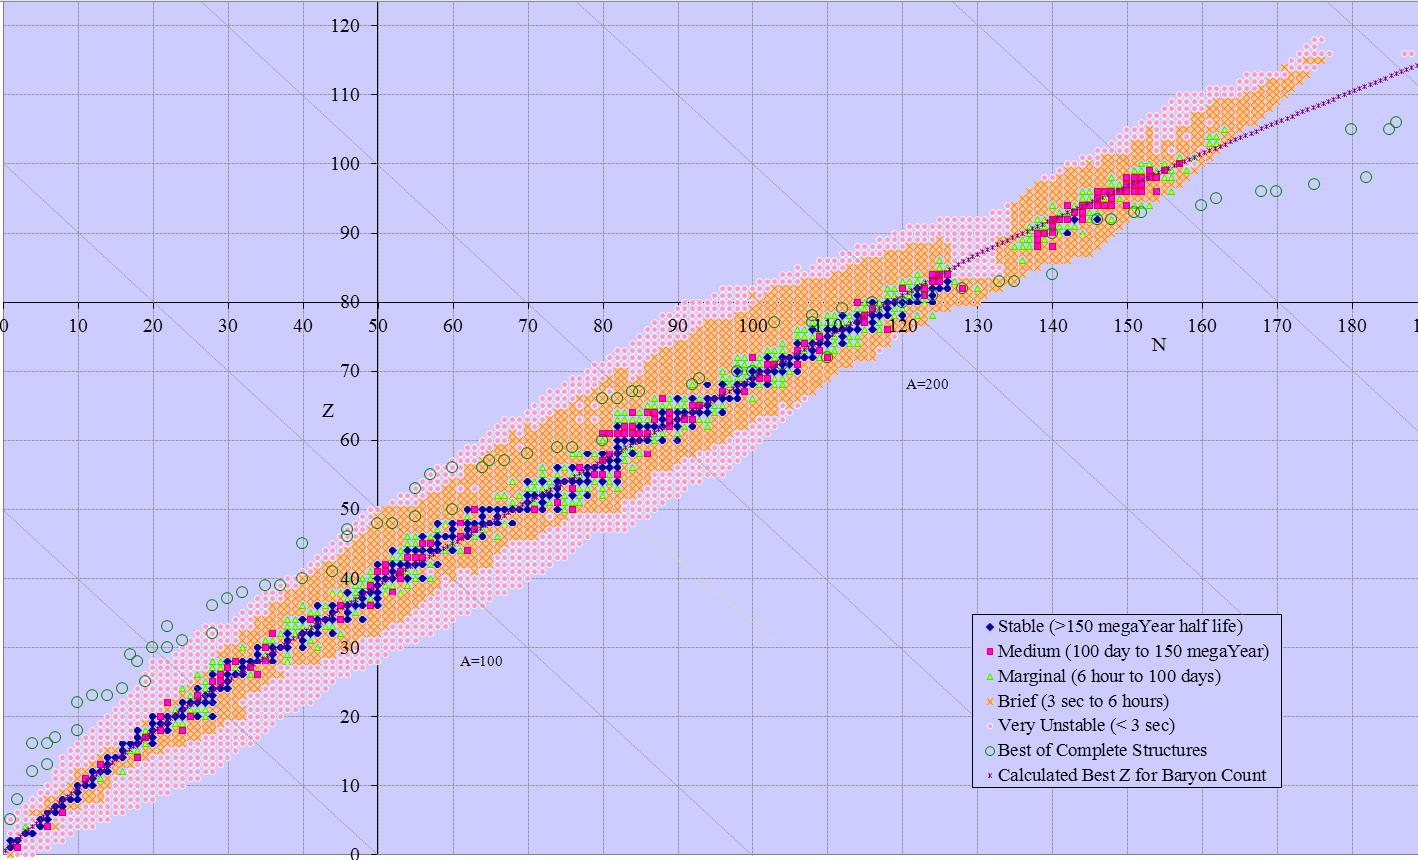 |
180×70 12,600 cells 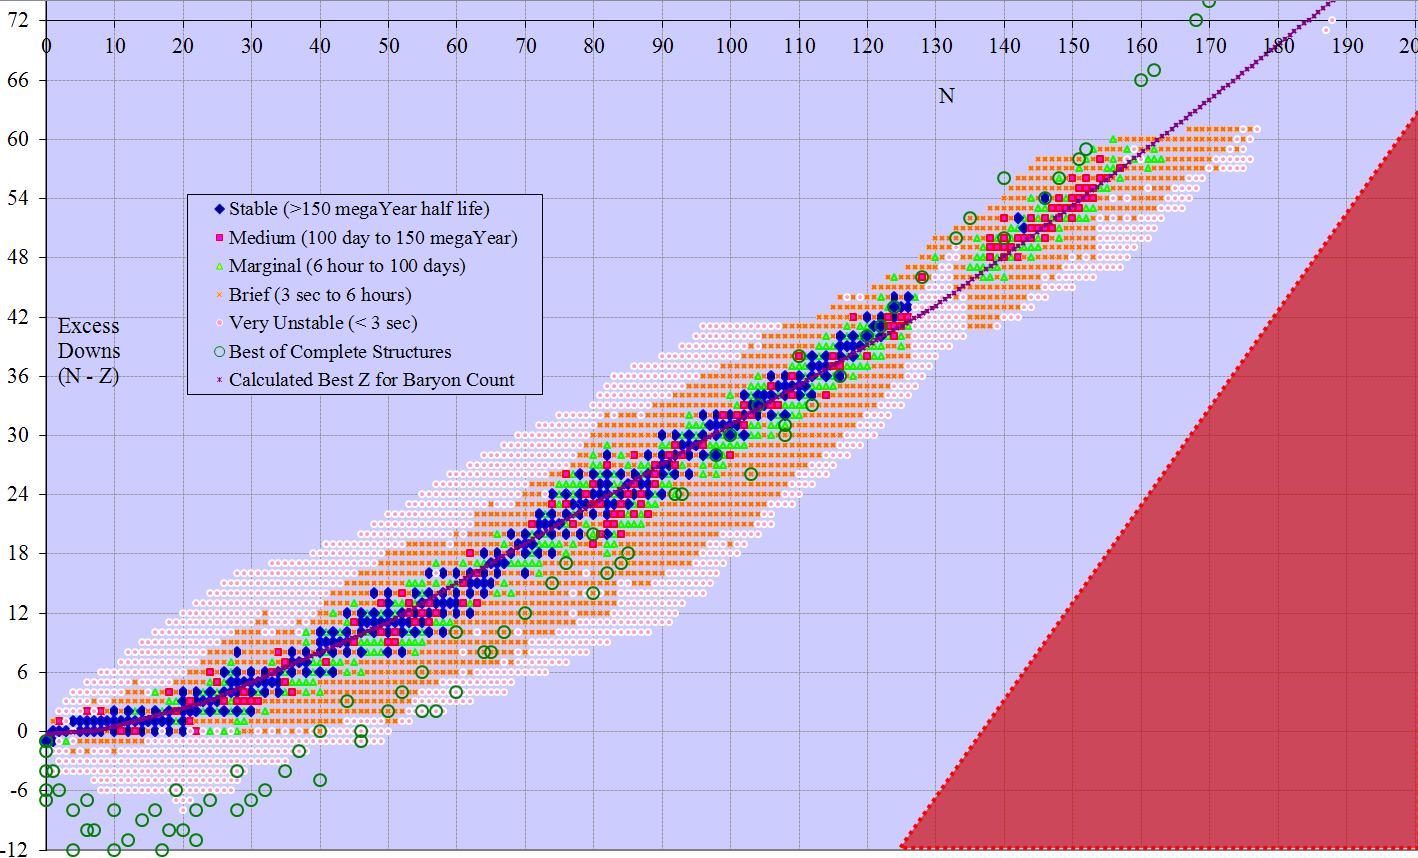 |
180/2×74 6,660 cells 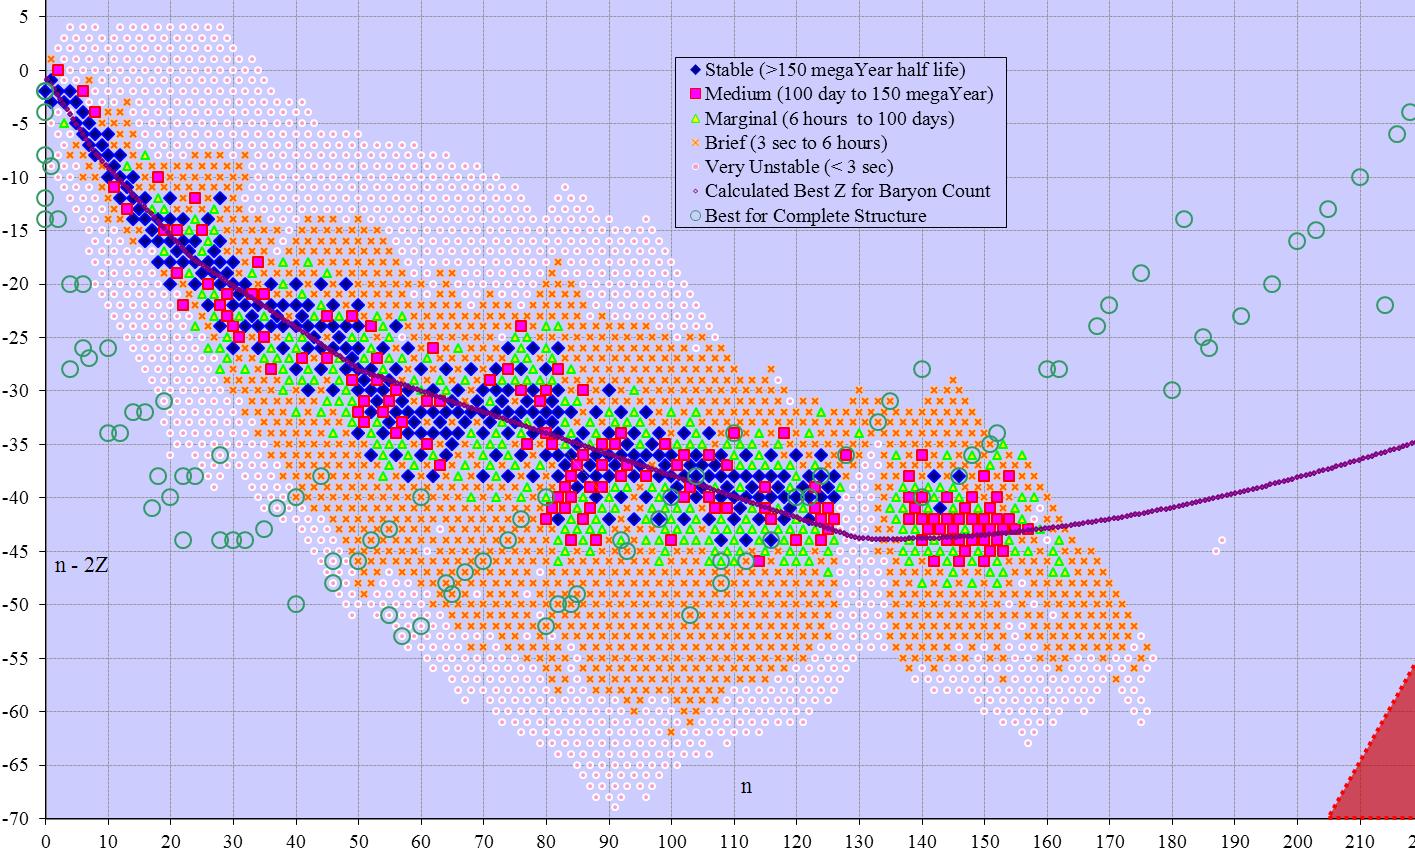 |
180/3×88 5,280 cells 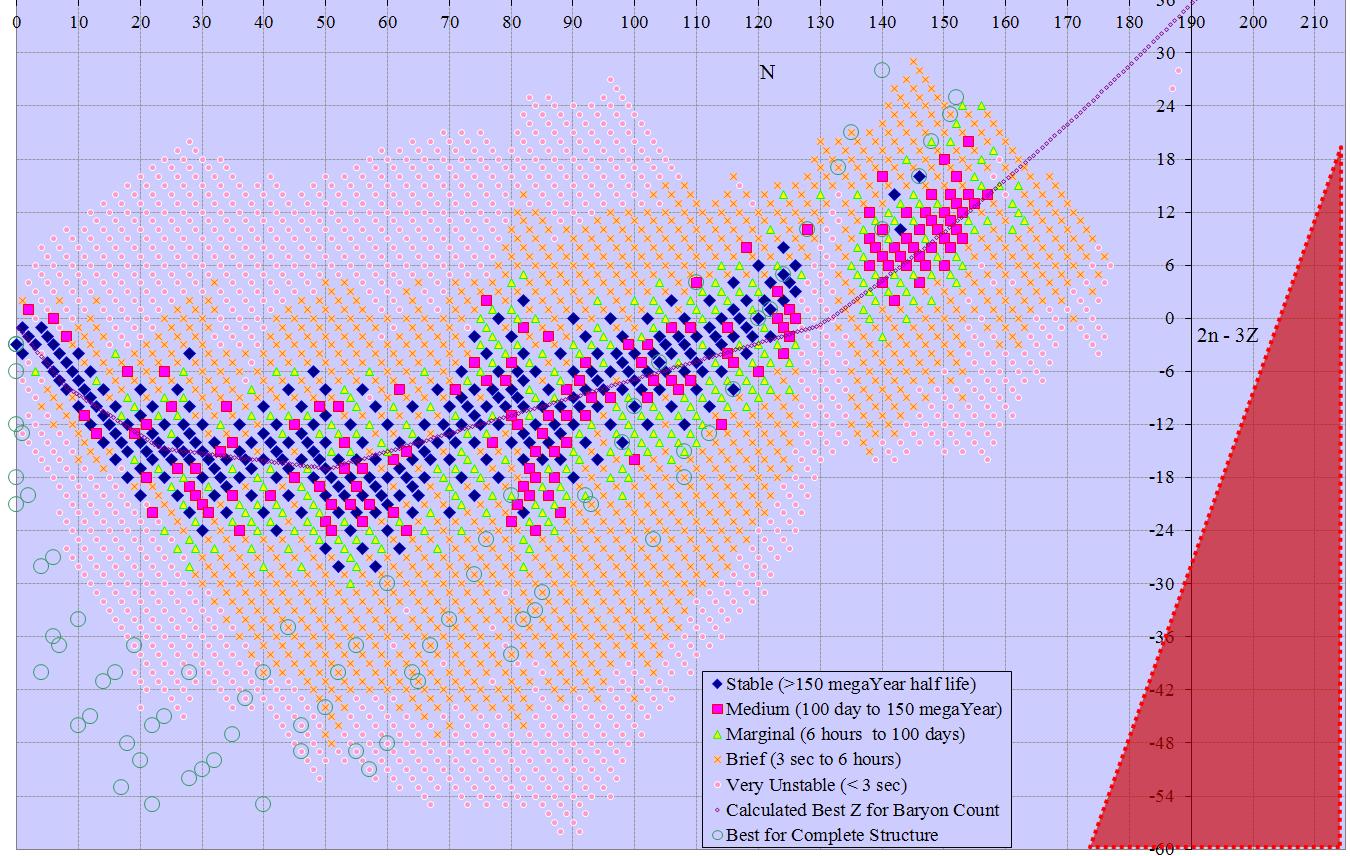 |
180/5×152 5,472 cells 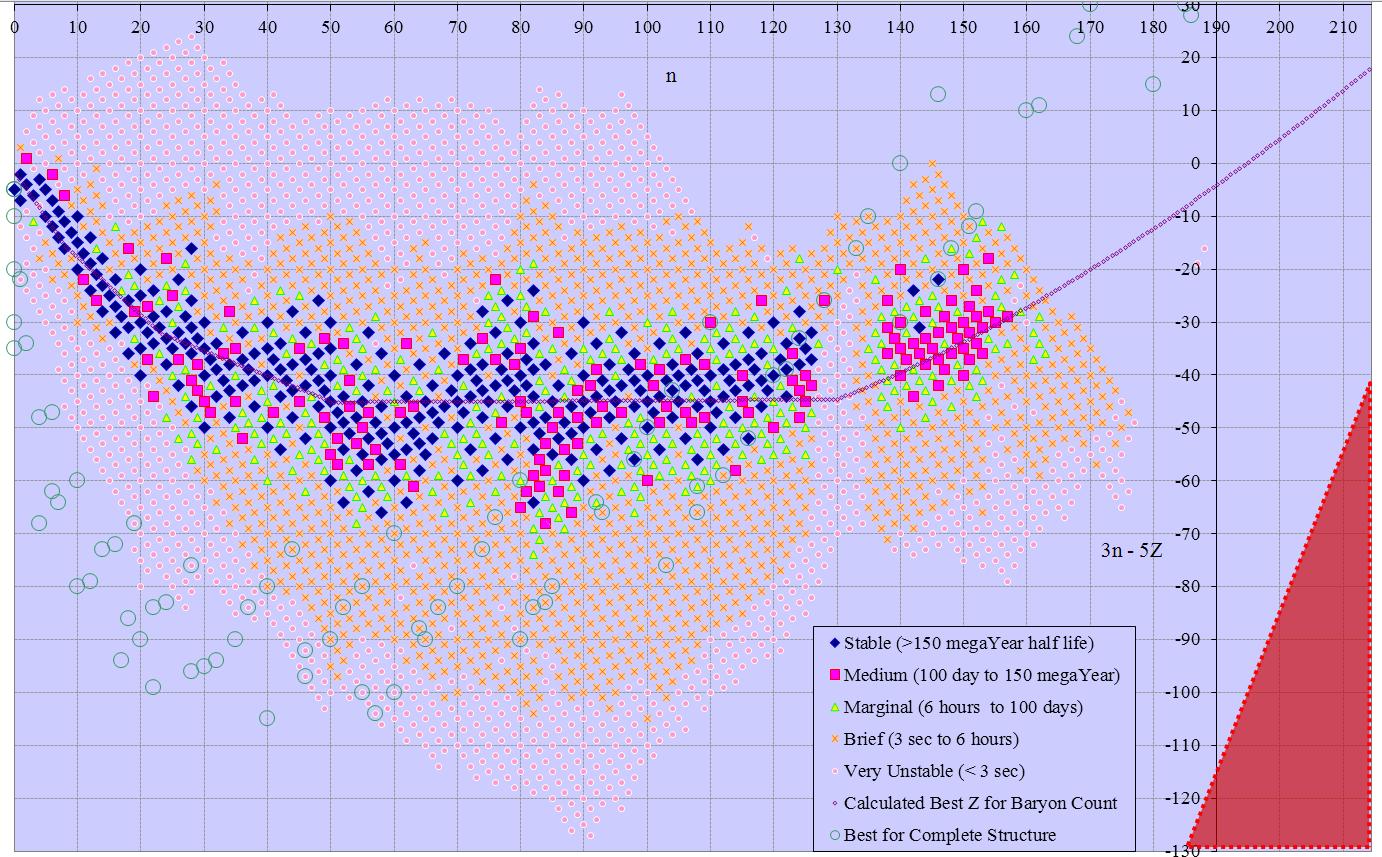 |
|
| z | 120×300 36,000 cells |
120×180 21,600 cells |
120×70 8,400 cells 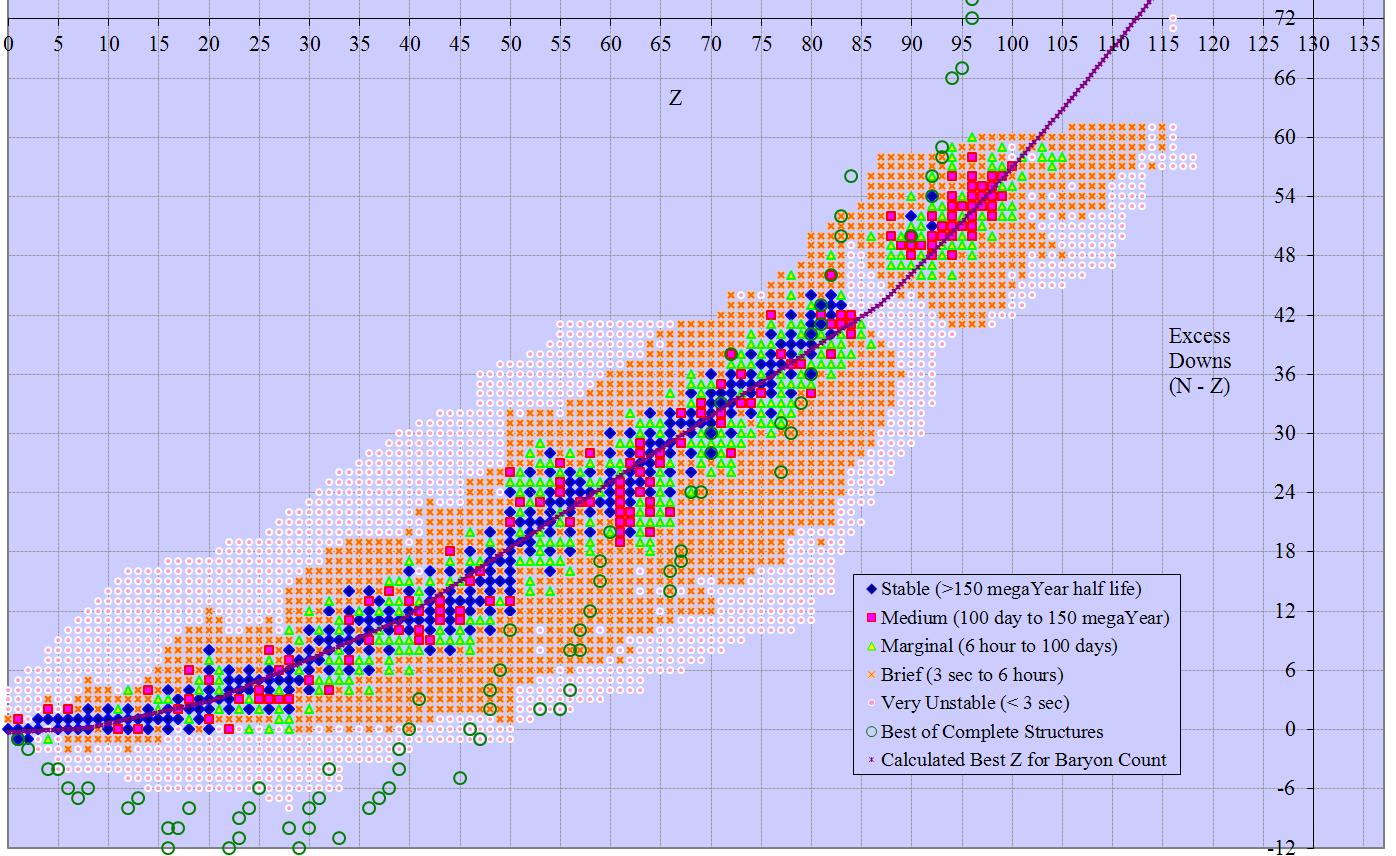 |
120×74 8,880 cells 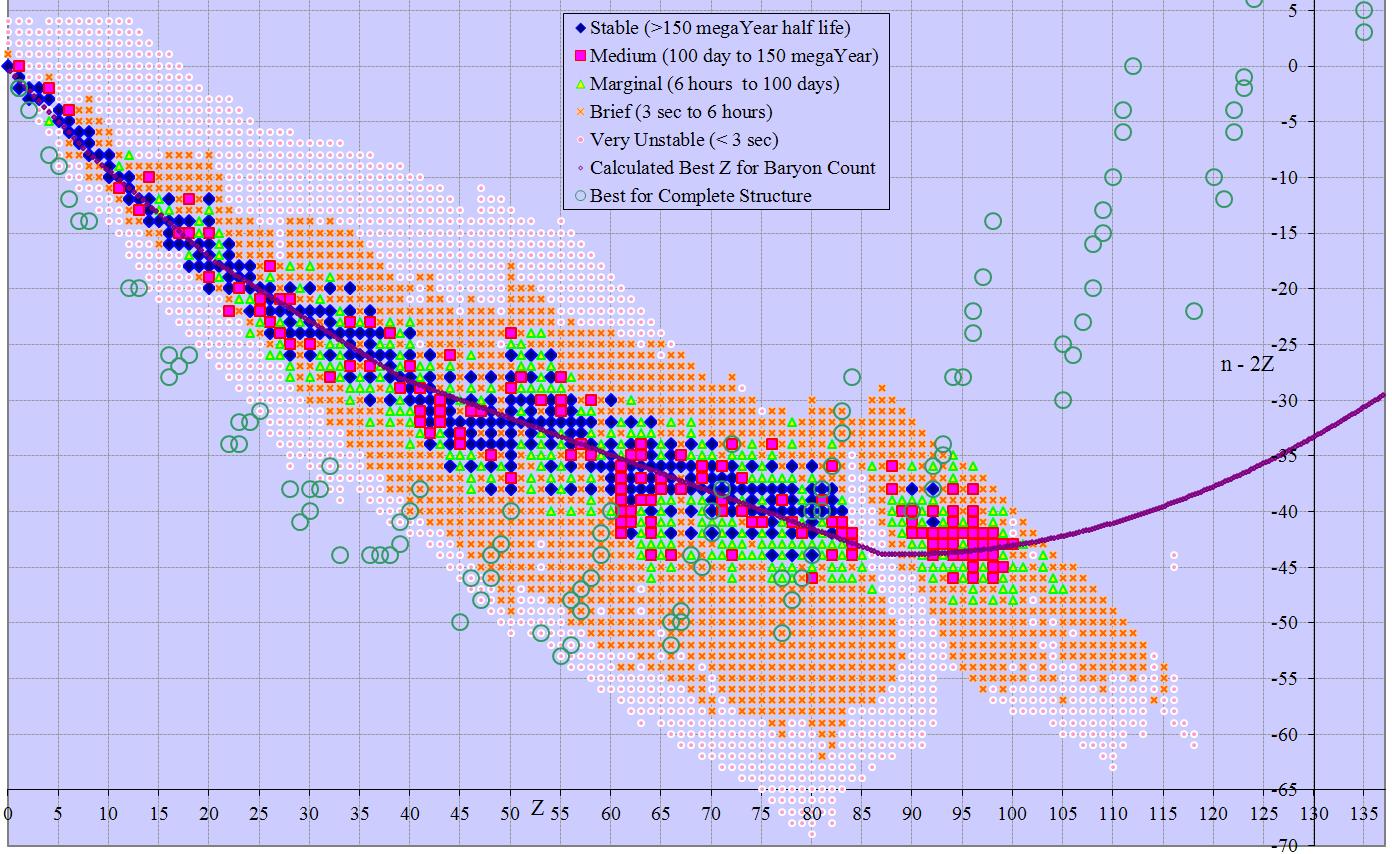 |
120/2×88 5,280 cells 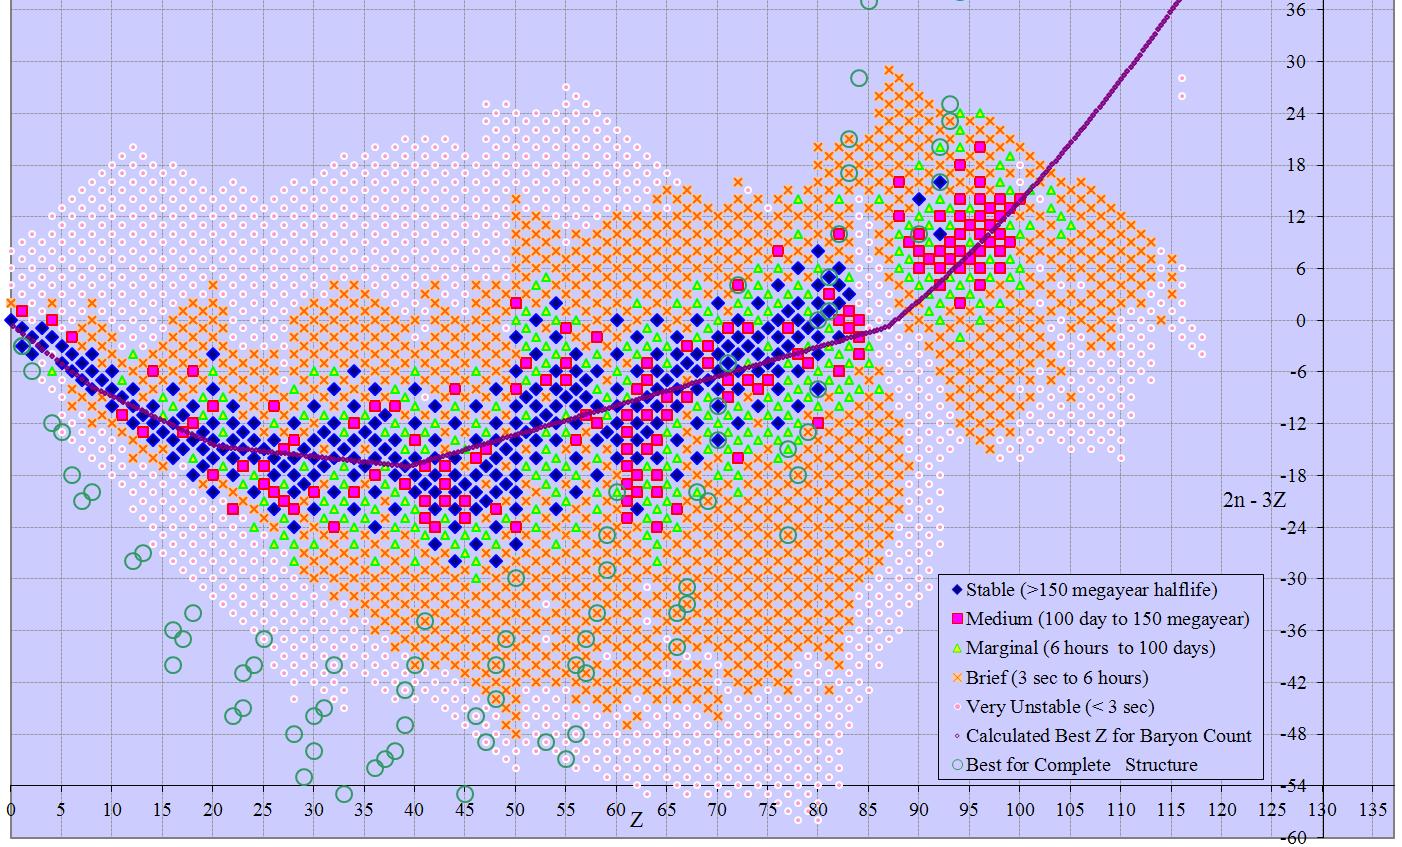 |
120/3×152 6,080 cells 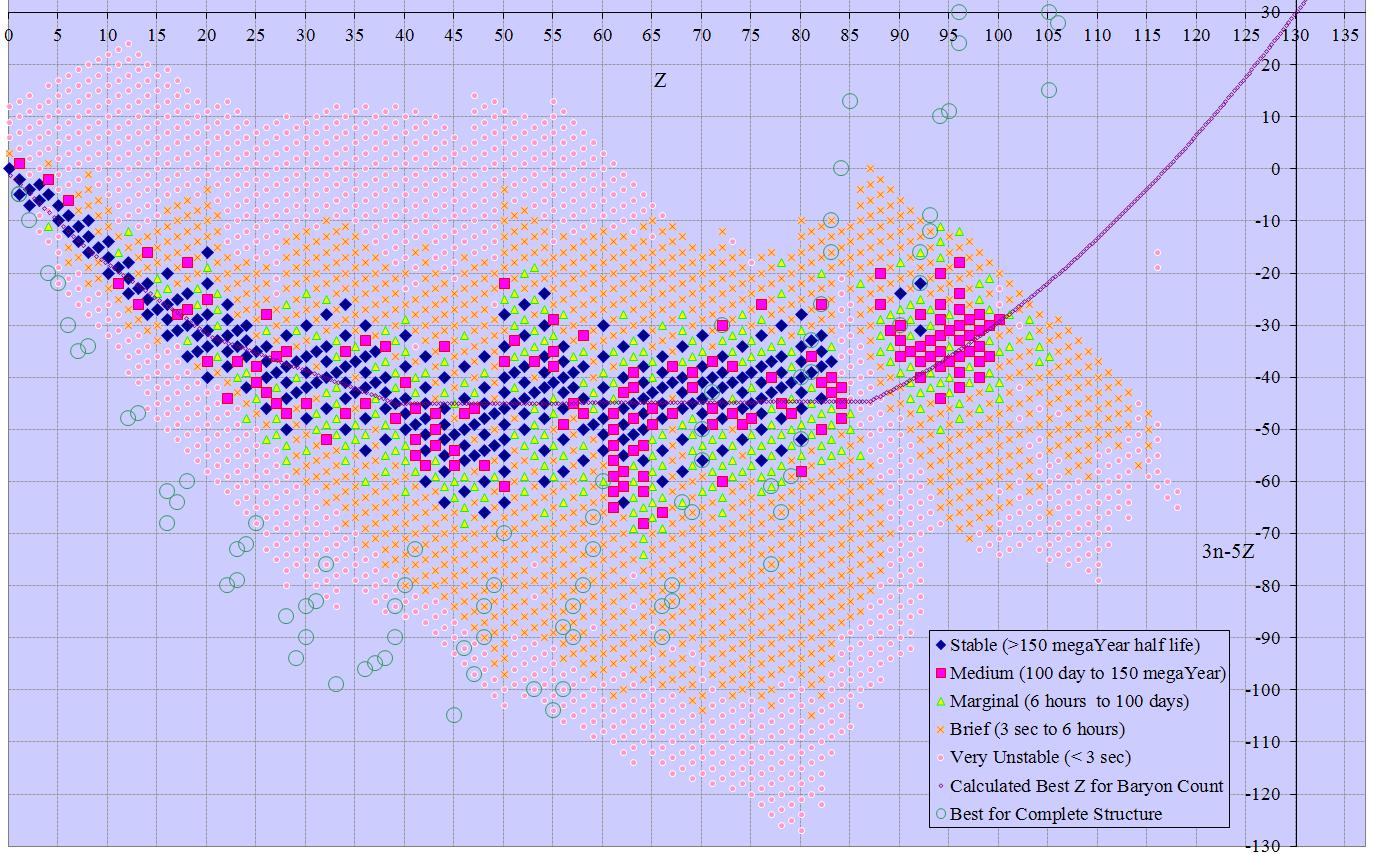 |
|
| n-z | 70×300/2 10,500 cells |
70×180 12,600 cells |
70×120 8,400 cells |
70×74 5,180 cells 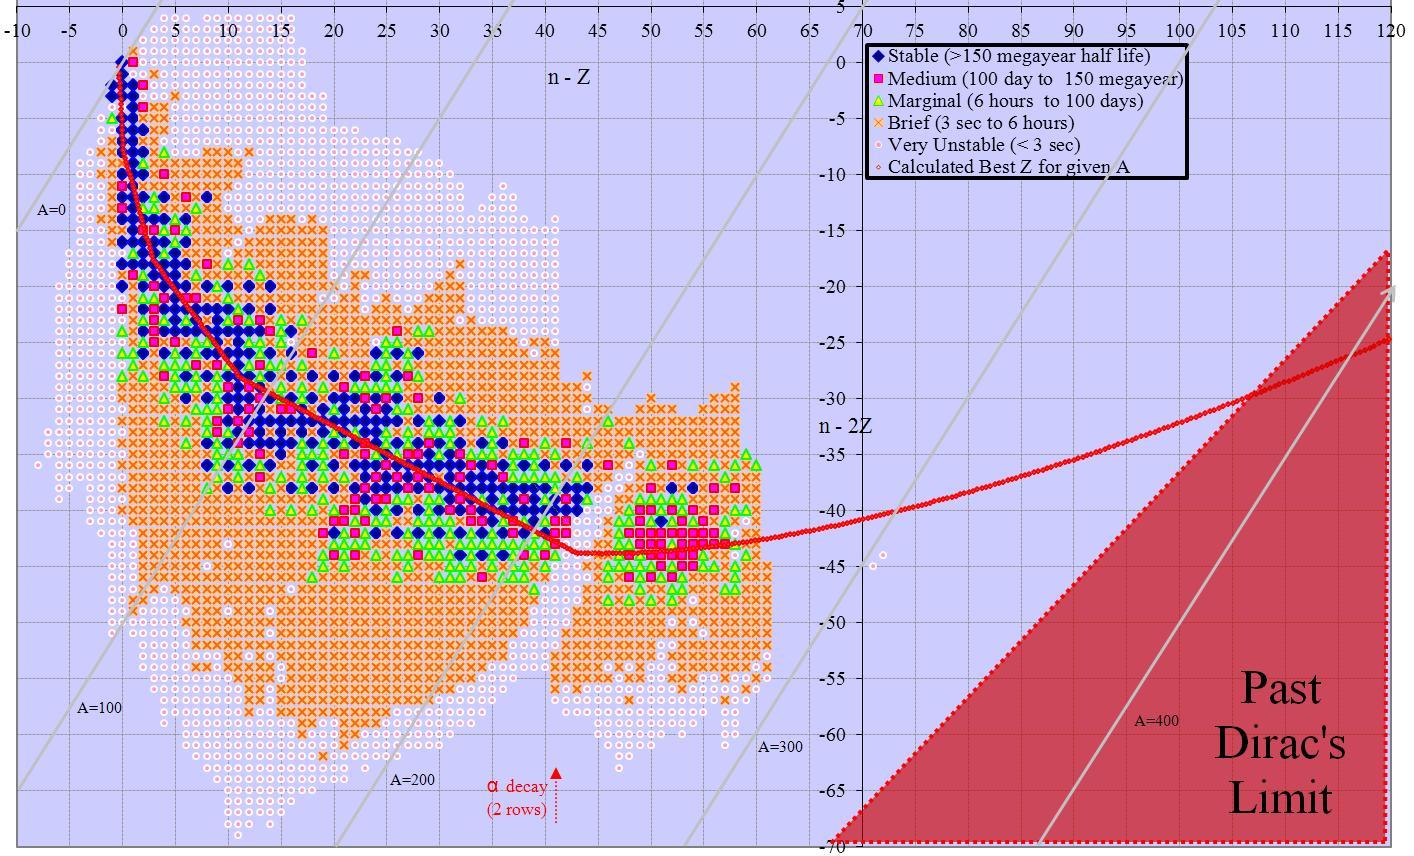 |
70×88 6,160 cells 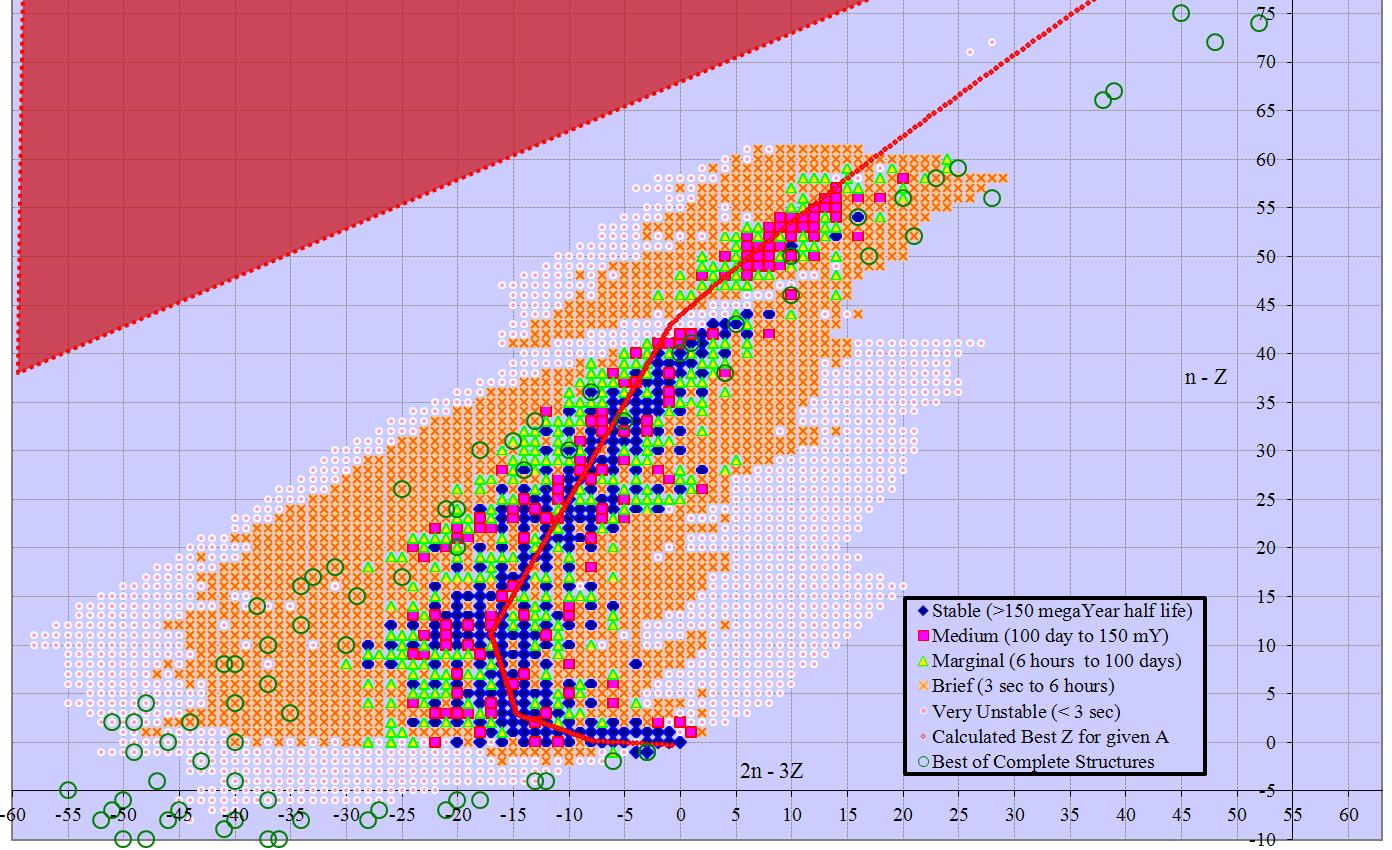 |
70×152/2 5,320 cells 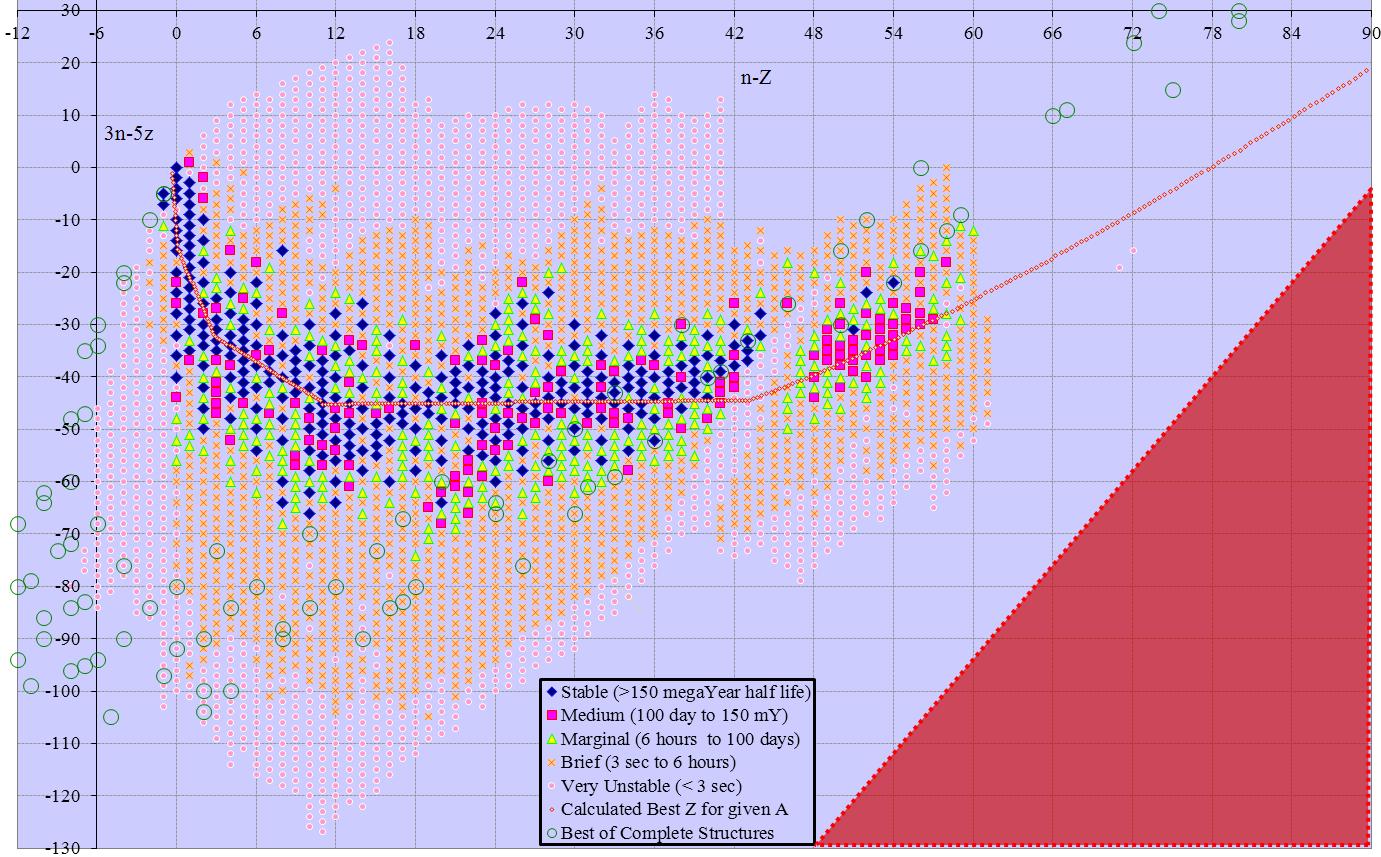 |
|
| n-2z | 74×300/3 7,400 cells |
74×180/2 6,660 cells |
74×120 8,880 cells |
74×70 5,180 cells |
74×88 6,512 cells 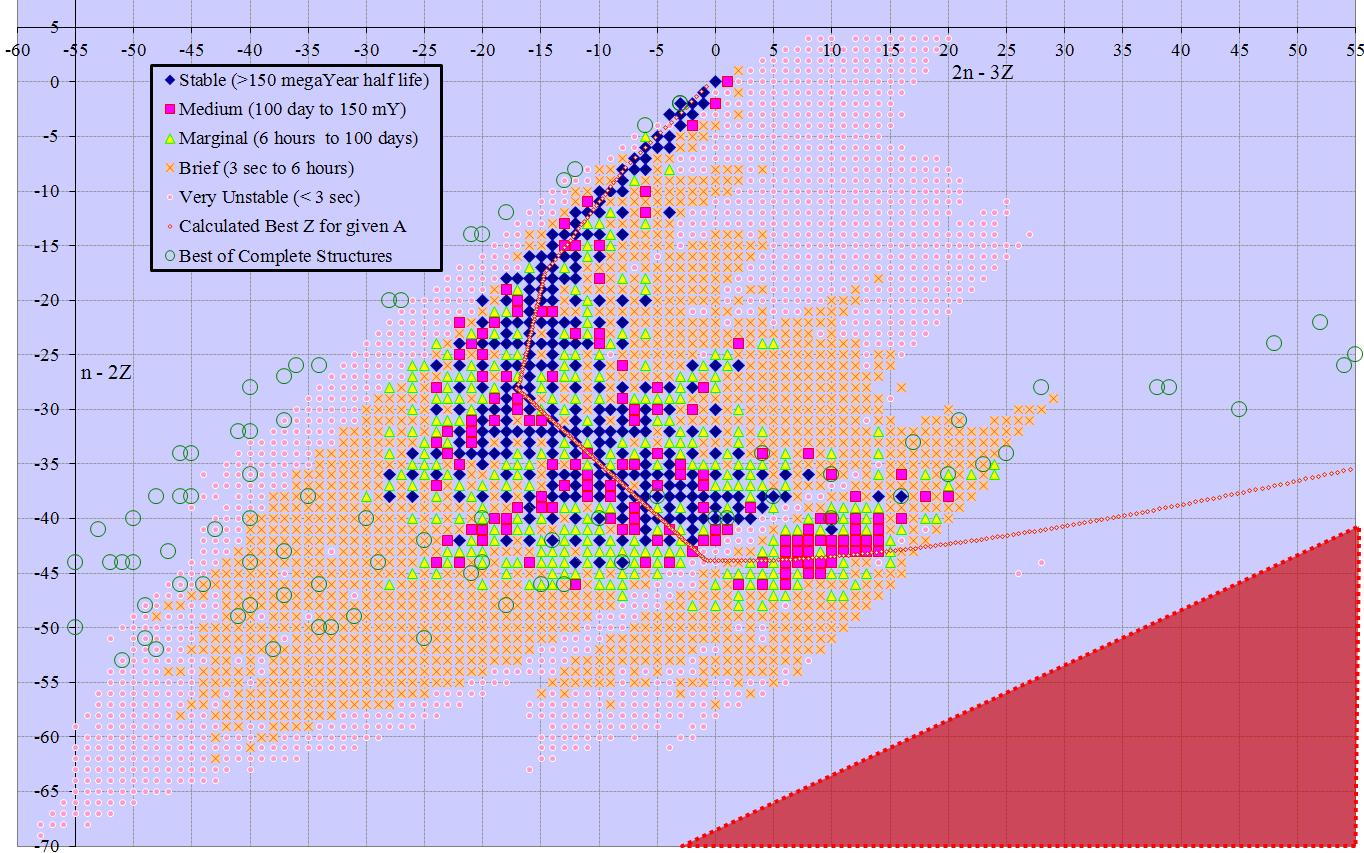 |
74×152 11,248 cells 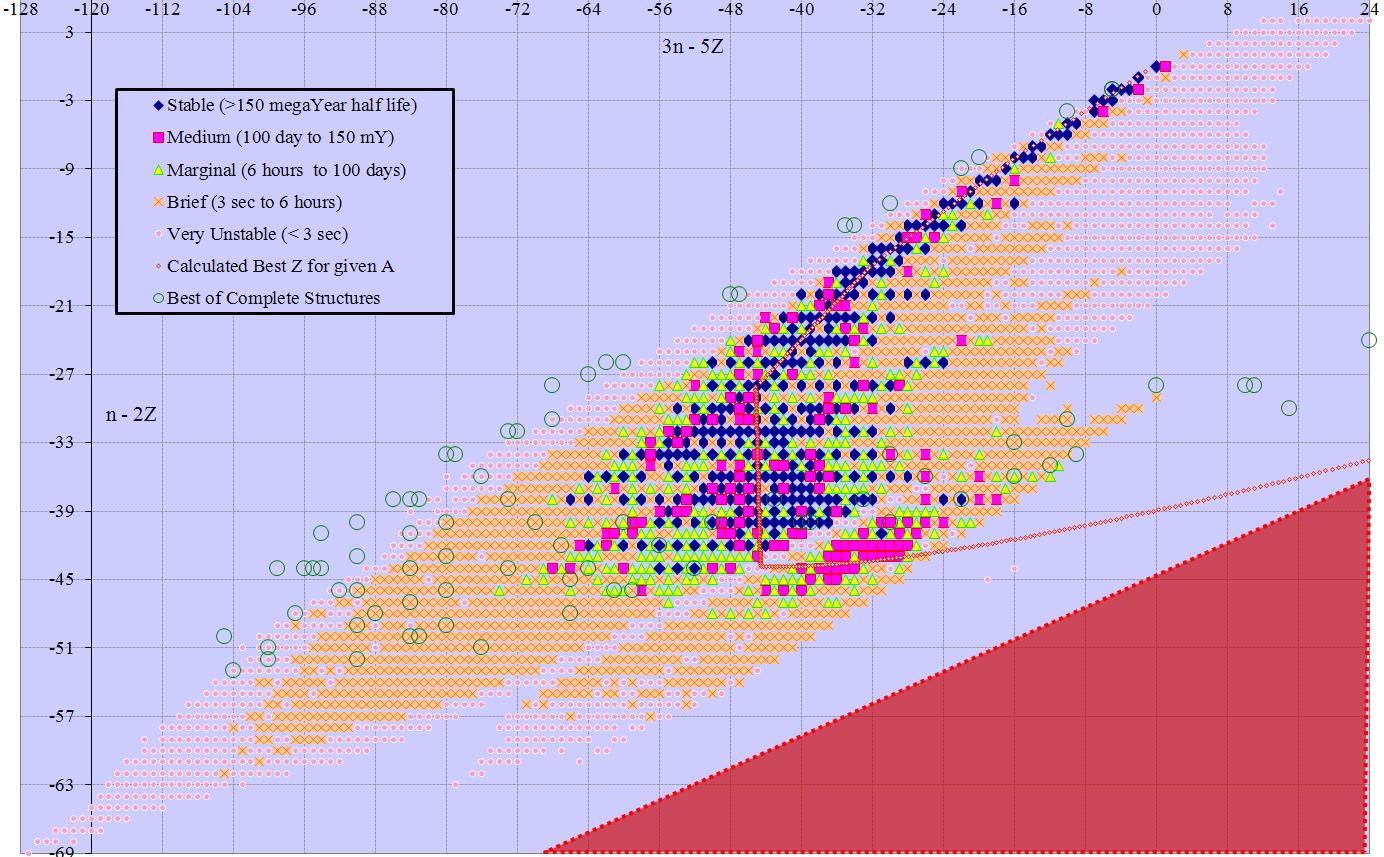 |
|
| 2n-3z | 88×300/3 8,800 cells |
88×180/3 5,280 cells |
88×120/2 5,280 cells |
88×70 6,160 cells |
88×74 6,512 cells |
88×152 13,376 cells 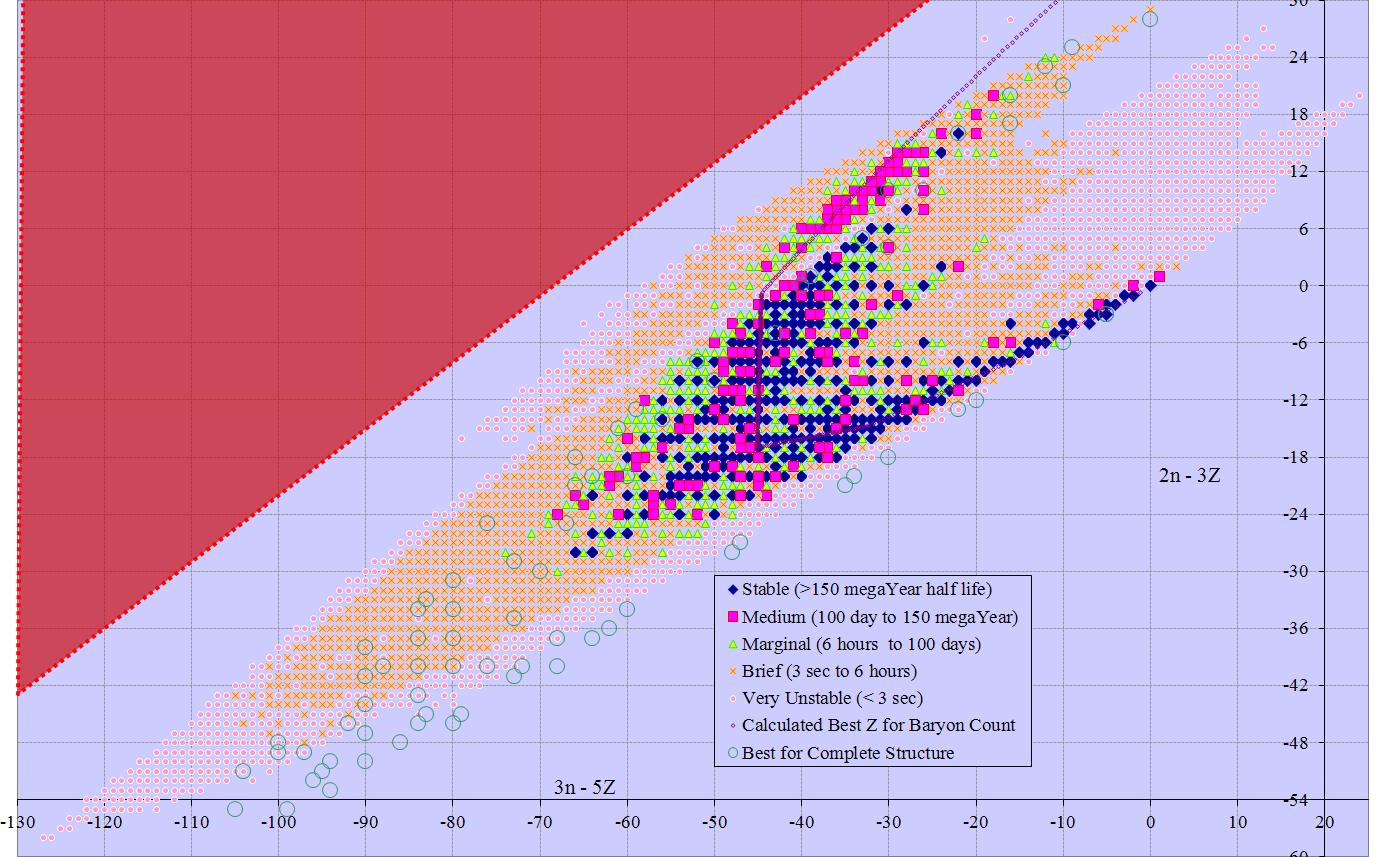 |
|
| 3n-5z | 152×300/5 9,120 cells |
152×180/5 5,472 cells |
152×120/3 6,080 cells |
152/2×70 5,320 cells 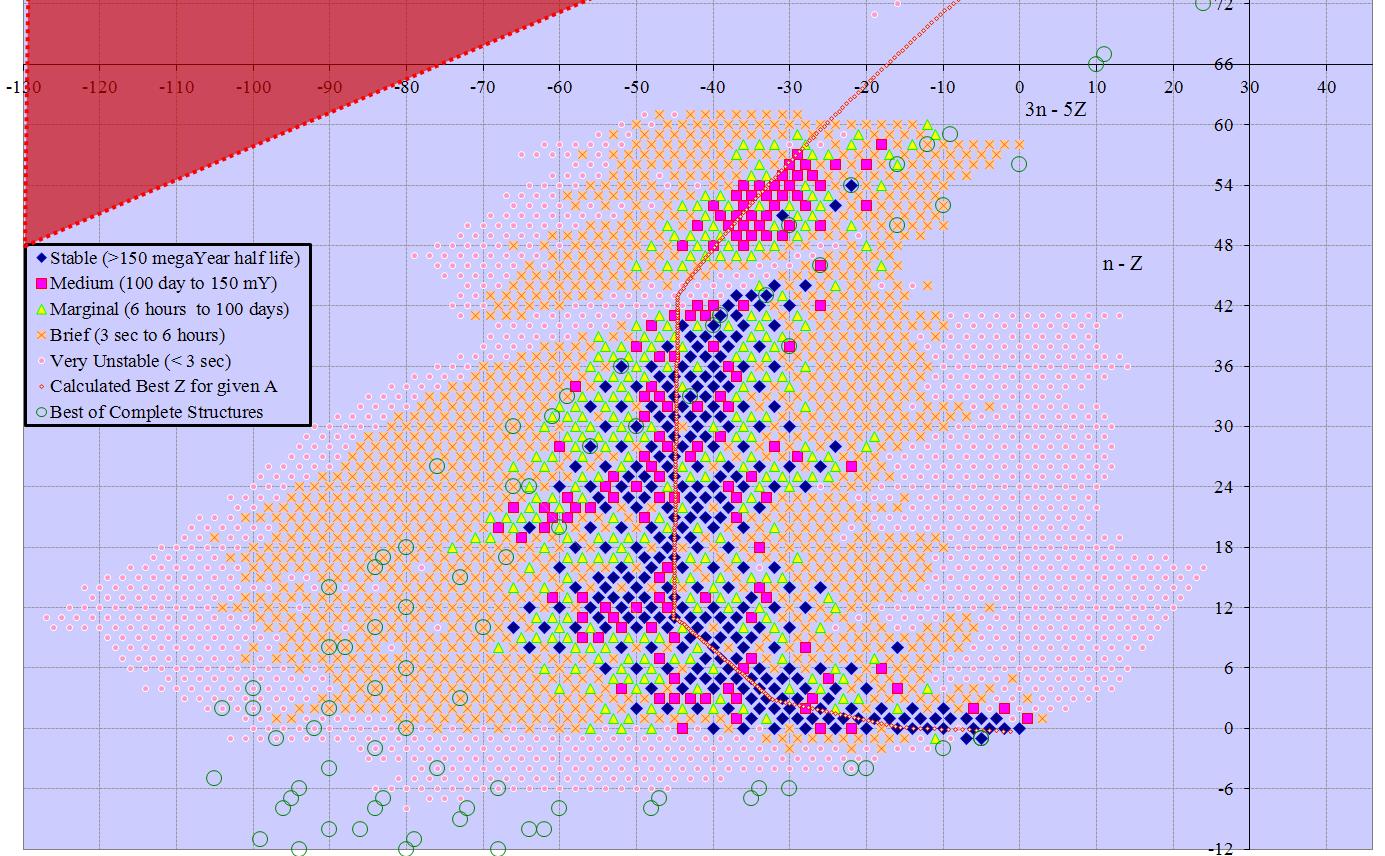 |
152×74 11,248 cells |
152×88 13,376 cells |
Note – the values for known isotopes give a somewhat misleading impression that n-z is the best fit for the first axis. When all possible isotopes are used (rather than just the known), n-2z is a better fit, ranging from -69 to +54. N – z ranges -8 to +200 for the highest possible isotope. Using z as the second axis is best there, with values from 0 to 137.
Links
Isotope table in compact form with half life info and structure links
Isotope table in compact form with energy info
Isotope table in compact form with decay mode
Isotope table in standard form with half life info and structure links
List of all reasonable structures